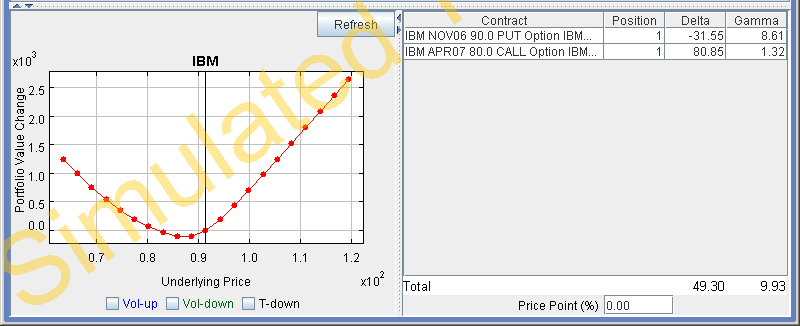
Sub-Portfolio Value
For the purposes of Interactive Analytics,SM a sub-portfolio includes all of your positions in an underlying and all of its derivatives. The Sub-Portfolio Value summary window shows the change in this subset of your portfolio's value over a range of underlying price changes, and shows the contribution that each position in your sub-portfolio makes to the slope and curvature of the Sub-Portfolio Value plot, at the price point shown at the bottom of the window. Each row of the table names a contract and shows your position as well as the contribution that position makes to the price risk (delta) and curvature risk (gamma) at the named price point. The final row of the table contains the total price and curvature risk at the named price point. The Sub-Portfolio Value plot to the left of the summary shows the total value of all your positions in an underlying and its derivatives over a specific price range for its underlying. You can view the Sub-Portfolio Value on the Position Risk and Underlying Summary tabs.

The Sub-Portfolio Value summary table lets you dissect the risk exposure of your sub-portfolio not only at the current market price (represented by a 0.0 price point) but also at any price within a specific price range. By examining both the slope and curvature contribution of each position, you can determine how to modify your sub-portfolio, thereby changing your sub-portfolio value curve to suit your own risk limits.
Use the Vol-up, Vol-down and T-down checkboxes to view the plot under different scenarios to help you visualize the volatility and time risk in your option positions. Vol-up raises the implied volatility by 15% in relative change*; Vol-down reduces the implied volatility by 15% in relative change*, and T-down reduces the time to expiry by one calendar day.
Create "what-if" scenarios to better understand the risk within your sub-portfolio. If your sub-portfolio value curve falls outside your risk tolerance for part of the specific price range, you can use the "what-if" feature to devise trades to reduce your risk profile to within your risk bounds. The "what-if" feature allows you to:
Change the underlying price to view the slope and curvature contributions that would prevail at that price.
Change any set of positions in your sub-portfolio to see how they would modify both the Sub-Portfolio Value plot and Sub-Portfolio Value summary.
Add new contracts to your "what if" sub-portfolio and set the position to see how they will modify both the Sub-Portfolio Value plot and Sub-Portfolio Value summary.
You can sort on any column by clicking the column header. To reverse the sort (from ascending to descending, or descending to ascending) click the column header again.
|
Sub-Portfolio Value Summary Table |
|
|
Field |
Description |
|
Contract |
Identifies the contract by underlying, instrument type, currency, (expiry, strike price, right). |
|
Position |
Your signed position in the contract. |
|
Delta |
The change of your portfolio value due to a one percent change in the underlying price, at the underlying price specified by the value in the Price Point field. This is the contribution to the slope of the Sub-Portfolio Value curve. |
|
Gamma |
The change in your associated Delta value due to a one percent change in the underlying price, at the underlying price specified by the value in the Price Point field. This is the contribution to the curvature of the Sub-Portfolio Value curve. |
|
Price Point |
The starting price point value of 0.00 corresponds to the current underlying price. Each whole number change (positive or negative) corresponds to a one-percent change in that direction in the underlying price. |
*For an example of a relative percent change, if the current implied volatility of an option is 10%, a 15% relative change would result in an implied volatility of 11.5%, calculated as follows:
10% * (1 + 0.15) = 11.5%.