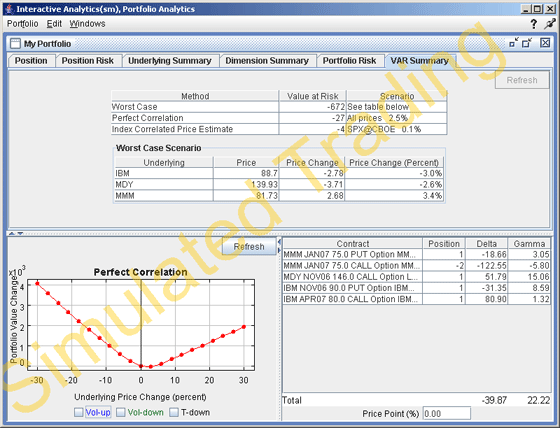
Value at Risk Summary
The VAR summary tab shows the greatest loss that a portfolio will sustain over a one-day period, with 99% confidence. To load the VAR summary, click the Refresh button in the upper right corner of the VAR page. The VAR's are calculated using three different methods, each with different assumptions about correlations of the underlying assets in the portfolio. The VAR summary is valid for US equity based stocks, options, futures and futures options.
Worst Case - Identifies the sum of the greatest loss of each underlying in your portfolio assuming each product moves independently to the worst loss within a 3 standard deviation range of each underlying.
Perfect Correlation - Assumes each product is perfectly correlated to a reference index. It then looks for the worst loss within a 4.5 standard deviation range of the reference index.
Index Correlated Price
Estimate - Assigns a correlation (Beta) to each underlying in your portfolio
to a reference index, and then looks for the worst loss within a 4.5 standard
deviation range of that index.
