Viewing Charts
Samples of several Interactive Charts with descriptions are displayed below.
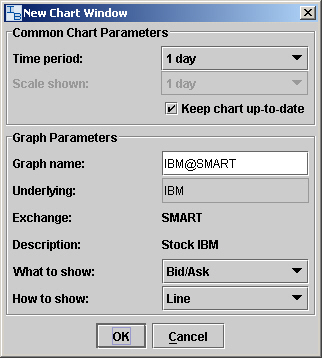
Sample A - A one-day Bid/Ask line chart for IBM.
The parameters you enter here are displayed in the line chart below.
Hold your mouse over any section of the line to see the Bid and Ask for a specific time.
Sample B - A one-day Trades 5 minute Bar chart for IBM.
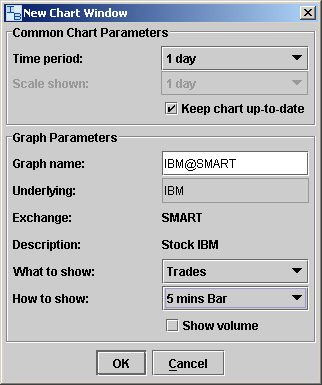
The Bar chart below shows all executed trades for IBM over the course of the current day.
Each 5 minute interval shows the opening and closing trade and is represented by either a red, green or black bar.
A red bar indicates that the price for the closing trade was lower than the price for the opening trade for this interval.
A green bar indicates that the price for the closing trade was higher than the price for the opening trade for this interval.
A black bar indicates no change in price for this interval.
The top of each bar is the highest priced trade for the interval.
The bottom of each bar is the lowest priced trade for the interval.
The protruding handles on the sides of each bar mark the opening trade and closing trade prices.
Hold your mouse over any bar to read all of the above details in text form.