Interactive Charts - Technical Analysis
Use the chart studies to overlay a technical indicator on your active chart.

To create a chart study
Create an Interactive Chart.
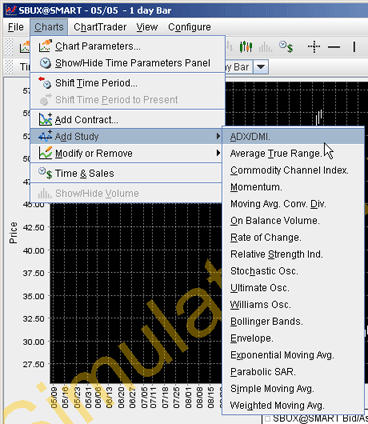
On the Charts menu select Add Study and then select the type of technical analysis indicator you want to create.
Select the contract (if you are comparing multiple assets).
Choose the source, either Trades or Midpoint.
If desired, modify any other indicator parameters and click OK.
The color legend for indicator lines appears at the bottom of the chart.