Trading Window
The Trading window comprises:
The Menus, located at the top of the page below the title
The dockable Trading toolbar, located immediately below the menus
The Pages tabset, located below the Trading toolbar and along the top of the column headings
The Rapid Order Entry panel
The Order Management panel, which encompass the Contract Description columns (Underlying, Exch and Description) and the Market Data and Order Management columns described in the tables below.
The Contract Description columns display information about the asset on a market data line. The Underlyingcolumn contains the asset's underlying symbol. The Exch column displays the default order destination you set for this asset. The Descriptioncolumn holds a summary of other contract parameters, including the instrument type, expiration date, strike price, option right and market segment when appropriate.
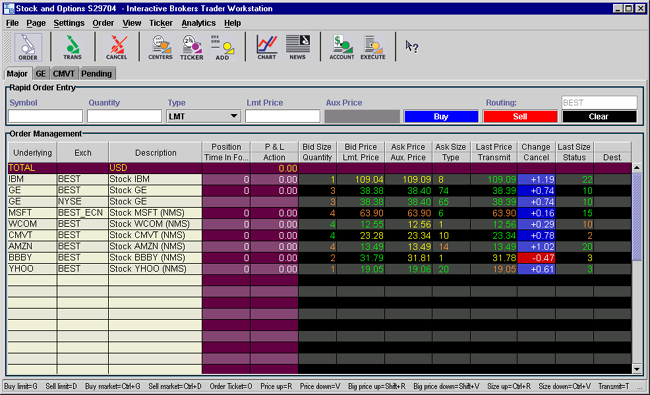
The Tradingscreen pictured below is in the default entry mode (Underlying), and shows all market data lines. The column headings in the top-most row above the trading area (Position, P&L, Bid Size, Bid Price, Ask Price, Ask Size, Last Price, Change, and Last Size) apply to information on the Market Data line. The table below has field names and descriptions.
A Market Data line provides real-time data specific to the product represented in the Underlying column. All available columns are described in the table below, although they may not appear in the graphic. To hide and display columns, use the Page Layout Manager.
Available Market Data Columns
|
Column Name |
Description |
|
Underlying (Symbol) |
The underlying symbol or exchange symbol for the contract. To toggle between underlying and symbol mode, on the View menu select the desired mode. |
|
Exch |
The exchange to which orders for the contract will be routed. Select SMART order routing to route directly to the best available market. |
|
Description |
Identifies the instrument type and other descriptive contract information. |
|
Position |
Your current position in the selected contract. |
|
Avg cost |
The average cost of the current position. |
|
P&L |
Displays unrealized gains or losses. To modify the P&L calculation used, on the Page menu click Layout. On the Columns tab, select P&L in the Market Data Row section and click Customize. Select either New Position P&L or Daily P&L. |
|
Unrealized P&L |
Displays unrealized gains or losses. Calculates unrealized P&L for stocks, stock options and futures options. Unrealized P&L is calculated using the formula: (current market price - average cost/share) x total number of shares The average cost per share is updated in realtime. |
|
Bid Exch |
Used only for options. Identifies the exchange(s) posting the best bid price on the options contract. |
|
Bid Size |
The approximate depth of the current bid. |
|
Bid Price |
The best bid price for a contract. This is the best price at which you could currently SELL. |
|
Model |
For options. The option model price is calculated using the underlying price, interest rate, dividends and other data that you enter using the Option Modeler. |
|
Ask Price |
The best ask price for a contract. This is the best price at which you could currently BUY. |
|
Ask Size |
The approximate depth of the current offer. |
|
Ask Exch |
Used only for options. Identifies the exchange(s) posting the best ask price on the options contract. |
|
Last Price |
The last price at which the contract traded. A "C" in front of the last price indicates that this is the previous day's closing price. |
|
Change |
How much the current price has risen or declined from the previous day's closing price. If the price has declined, the background is red. If the price has risen, the background is blue. To toggle between dollar change and percent change, click the column title. |
|
Change (%) |
The percentage that the current price has risen or declined from the previous day's closing price. If the price has declined, the background is red. If the price has risen, the background is blue. To toggle between percent change and dollar change, click the column title. |
|
Last Size |
The size of the last contract traded. If the last contract traded is larger than the previous one, the font is green. If it's smaller, the font is red. |
|
Imp Vol (%) |
For options. The implied volatility is based on the average of the best bid and offer for an option. This calculation is non-linear, and may not converge for low vega options. In such cases, no implied volatility estimate will be displayed. |
|
High |
High price for the day for the selected contract. |
|
Low |
Low price for the day for the selected contract. |
|
Volume |
Trading volume for the day for the selected contract. |
The Trading window below is operating in Symbol entry mode and shows both a Buy and Sell Order Management line. Column headings in the bottom-most row above the trading area (Time in Force, Action, Quantity, Lmt. Price, Aux. Price, Type, Transmit, Cancel, Status and Destination) apply to information on an Order Management line. The table below has field names and descriptions.
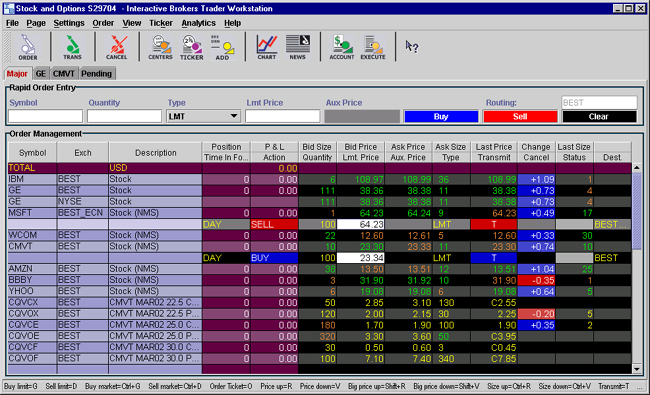
An Order Management line contains information about the order you have created, and appears immediately below the Market Data line for the asset you're trading. All available columns are described in the table below, although they may not appear in the graphic. To hide and display columns, use the Page Layout Manager.
Order Management Columns
|
Column Name |
Description |
|
Trailing Key |
System-created key to identify pieces of a bundled limit, bracket or trailing stop order. |
|
Account (Allocation) |
Displays the account number of the beneficial account. (For FA accounts, the Allocation column lets you select an account, create a new allocation profile, allocate shares based on percent of equity in each account, or define an absolute number of shares to be allocated to specified accounts. |
|
OCA Group |
Allows you to create a one-cancels-all advanced order group without opening the Order Ticket window. |
|
Time in Force |
The time period during which your order remains active: Day order or Good-Til-Canceled. |
|
GTD Expire |
Keeps the order active until the close of market on the date you enter. Date format is YYYY/MM/DD. |
|
Action |
The order action. BUY, SELL or SELL SHORT. |
|
Quantity |
The number of units in your order. |
|
Lmt Price |
The limit price for order types to which this price applies, including Limit, Stop Limit, and Relative orders. |
|
Aux. Price |
This field reflects the Election price for Stop and Stop Limit orders, and the Offset Amount for Relative and Trailing Stop orders. You can set these auxiliary amounts in the Default Order Settings box. |
|
Stop Price |
The Election price for Stop and Stop Limit orders. |
|
Type |
The order type. |
|
Transmit |
Click to transmit the order. |
|
Cancel |
Click to cancel the transmitted order. |
|
Status |
The order status. See Guide to System Colors for details. |
|
Dest. |
The order destination. |
|
Swp Fill |
Check to create a sweep-to-fill order. |
|
Disp Size |
Enter a display size to create an iceberg order. |
|
Origin |
The customer type from which the order originated. Mainly used for institutional accounts. |
|
Hidden |
Check to create a hidden order. |
|
Discretionary |
Enter a discretionary amount with a limit order to create a discretionary order. |
|
Volatility |
Displays volatility for the option at a specific strike price. |
The Trading toolbar is movable and configurable. To add or remove buttons, right-click in the toolbar and select Configure Toolbar.
To move and dock the toolbar, click and drag on the textured drag bar to the left of the first toolbar icon.
The Trading Pages
You can create up to 24 trading pages, each of which can hold up to 40 market data lines. Navigate between pages by clicking the appropriate tab in the Pages tabset. Each Trading page lists Contract, Exchange, and Description on the left. Each contract contains a Market Data line that displays the Bid Exchange, Bid Size, Bid Price, Ask Exchange, Ask Size, Ask Price, Last Price, Change, and Last Size. When you create an order, an Order Management line appears directly below the asset's Market Data line.
Copyrights and Trademarks