View Historical Charts
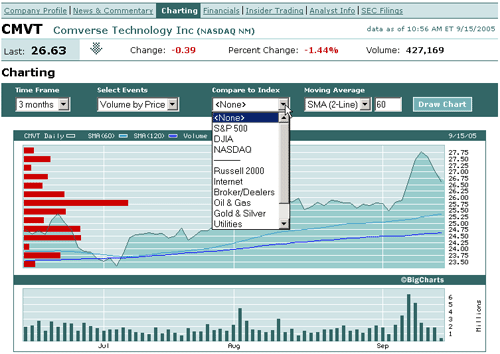
Define a historical chart using a time period from 1 day to one decade. You can also create interactive charts that update in real-time.
To view historical charts
On the trading screen, highlight
a contract and use the right-click menu to select Analysis,
then select Historical
Charts.
Define chart parameters such as time frame, events, index comparison and moving average, then click Draw Chart.

Any time you modify chart parameters, you must click Draw Chart to update.