Charting Volatility
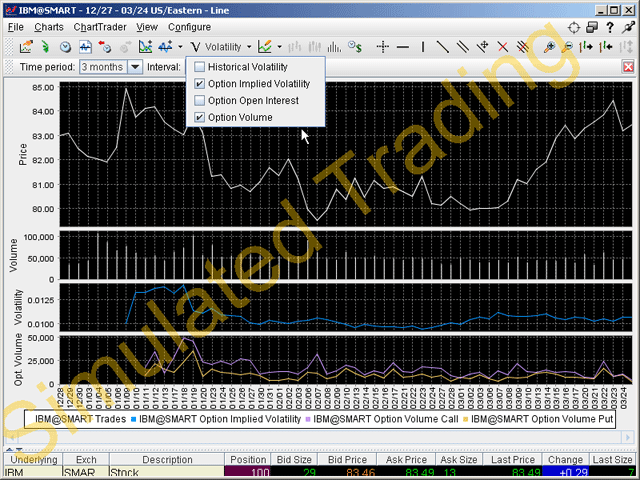
Use the Volatility drop-down to chart historical volatility, option implied volatility, option open interest and option volume.

Chart volatility
Use the Volatility dropdown to select one or multiple volatility charting parameters.
Note that to display Historical Volatility you must select a time period of 3 months or greater.
Each parameter is displayed in its own section below the master chart. The color key runs along the bottom of the chart.
|
Parameter |
Description |
|
Historical Volatility |
Displays actual historical volatility for the option. |
|
Option Implied Volatility |
A prediction of how volatile an underlying will be in the future. The IB 30-day volatility is the at-market volatility estimated for a maturity thirty calendar days forward of the current trading day, and is based on option prices from two consecutive expiration months. |
|
Option Open Interest |
Charts the total number of options that were not closed. |
|
Option Volume |
The total number of contracts traded over a specified time period. |