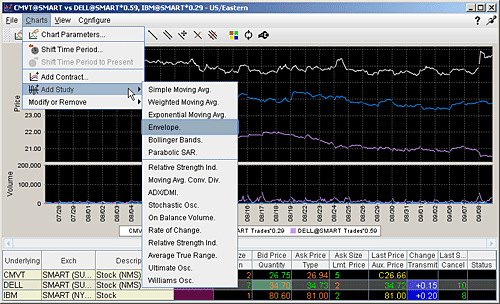
Apply Envelope Indicator
SMA/WMA/EMA Envelopes plot a band composed of two moving averages, one which is shifting upwards, the other shifting downwards, to help define a stock's upper and lower boundaries. The bands of an envelope are calculated as follows:
Upper Band = MA(CLOSE, N)*[1+K/100]
Lower Band = MA(CLOSE, N)*[1-K/100]
Where:
MA — Simple (or Weighted or Exponential) Moving Average;
N — averaging period;
K/100 — the value of shifting from the average (measured in basis points).
To apply an Envelope indicator
On the Charts menu select Add Study.
From the list of study indicators, select Envelope.
