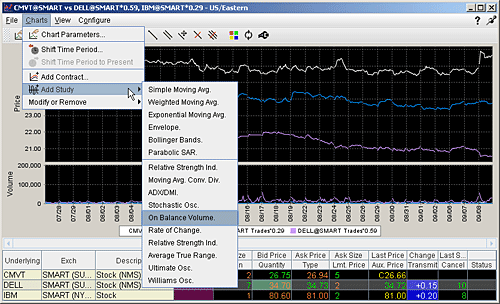
Apply an On Balance Volume Indicator
The concept behind the OBV indicator is: volume precedes price. OBV is a simple indicator that adds a period's volume when the close is up and subtracts the period's volume when the close is down. A cumulative total of the volume additions and subtractions forms the OBV line.
If today’s close is greater than yesterday’s close then: OBV(i) = OBV(i-1)+VOLUME(i)
If today’s close is less than yesterday’s close then: OBV(i) = OBV(i-1)-VOLUME(i)
If today’s close is equal to yesterday’s close then: OBV(i) = OBV(i-1)
Where:
OBV(i) — is the indicator value of the current period.
OBV(i-1) — is the indicator value of the previous period.
VOLUME(i) — is the volume of the current bar.
To apply a On Balance Volume indicator
On the Charts menu select Add Study.
From the list of study indicators, select On Balance Volume.
