Portfolio Analytics - Dimension Summary
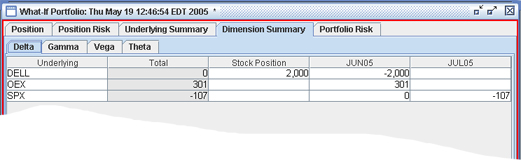
Each Greek value represents a different dimension of risk. The Dimension Summary page tabulates the total risk by underlying and expiry for each of these risk dimensions.
|
Dimension Summary Tab |
|
|
Risk Dimension |
Description |
|
Delta |
Delta represents the change in an option price relative to a change in the price of the underlying. Each cell in the expiry column(s) represents the sum of all Delta risk positions for the given underlying and expiry. |
|
Gamma |
Gamma represents the rate of change of Delta. Each cell in the expiry column(s) represents the sum of all Gamma risk positions for the given underlying and expiry. |
|
Vega |
Vega represents the change in an option price relative to a change in volatility. Each cell in the expiry column(s) represents the sum of all Vega risk positions for the given underlying and expiry. |
|
Theta |
Theta represents the time-value decay. Each cell in the expiry column(s) represents the sum of all Theta risk positions for the given underlying and expiry. |
A Portfolio Value plot can be seen at the bottom left of the window. It shows the change in portfolio market value over a range of underlying price changes.