Portfolio Analytics - Portfolio Risk
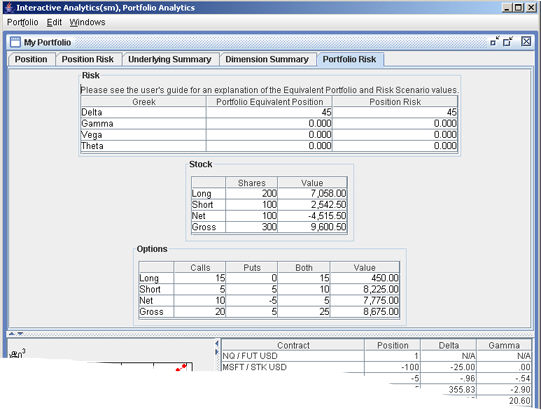
Displays the equivalent portfolio risk for all positions, and provides a summary of all stock and options values in your portfolio.
|
Portfolio Risk Tab |
|
|
Risk Table |
Description |
|
Greek |
|
|
Portfolio Equivalent Position |
Hypothetically scales all positions in your portfolio to be equal to $100.00 per share. |
|
Position Risk |
Shows the change in the Greeks if the price of each underlying were to change by one dollar (1%). |
Below the Risk table are two summary tables of all Stock and Option positions in your portfolio. The Stock summary shows all long positions, all short positions, the net and the gross shares, and the corresponding values. The Option summary shows all long calls and puts, all short calls and puts, and the net and gross units, and the corresponding values.
A Portfolio Value plot can be seen at the bottom left of the window. It shows the change in portfolio market value over a range of underlying price changes.