Portfolio Analytics - Underlying Summary
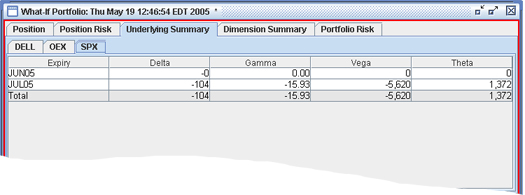
The Underlying Summary page tabulates the total risk by expiry and risk dimension for each underlying.
|
Position Tab |
|
|
Field |
Description |
|
Expiry |
The expiry for the given underlying. |
|
Delta |
The sum of all Delta risk positions for the given underlying and expiry. |
|
Gamma |
The sum of all Gamma risk positions for the given underlying and expiry. |
|
Vega |
The sum of all Vega risk positions for the given underlying and expiry. |
|
Theta |
The sum of all Theta risk positions for the given underlying and expiry. |
A Sub-Portfolio Value plot can be seen at the bottom left of the window. It shows the change in the sub-portfolio market value over a range of underlying price changes (a sub-portfolio includes all of your positions in an underlying and all of its derivatives).