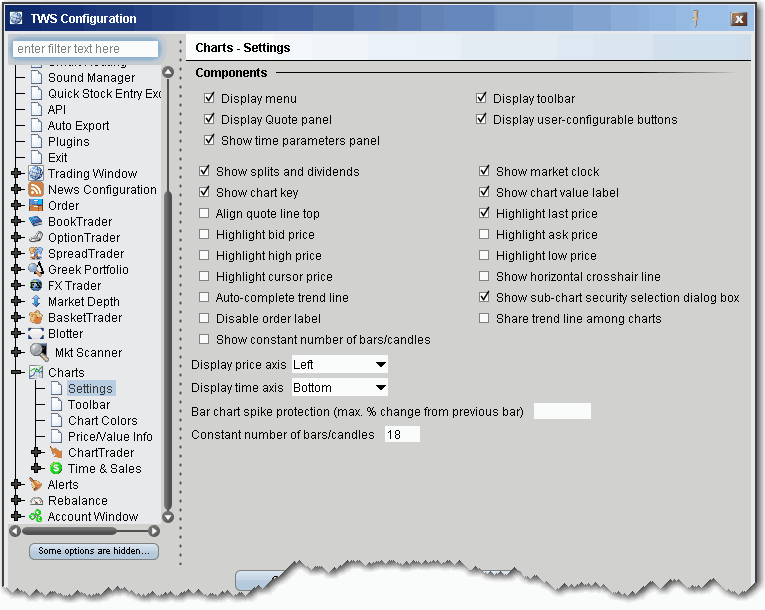
Use the Charts configuration page to define basic settings, hotkeys, buttons and to control the visibility of column fields.
|
|
|
|
Display menu - check to see the Charts menu.
|
Display toolbar - check to see the Charts toolbar.
|
|
Display Quote panel - if checked, the Quote panel, which shows market data for the contract, displays at the bottom of the chart window.
|
Display user-configurable buttons - Applies to ChartTrader. If checked, the buttons you configure from the Buttons subsection of the ChartTrader configuration area will be displayed.
|
|
Show time parameters panel - if checked, the toolbar that displays time parameters is visible at the top of the chart.
|
|
|
Show splits and dividends - if checked, splits and dividends (when applicable) are noted directly on the chart.
|
Show market clock - if checked, displays the time in the top title bar.
|
|
Show chart key - if checked, displays a key to the color, type of chart and asset charted along the bottom of the chart.
|
Show chart value label - if checked, the Price, Volume and other axis labels are displayed.
|
|
Align quote line top - if checked, the Quote Panel moves from the bottom to the top of the chart.
|
Highlight last price - check to highlight the price of the last trade.
|
|
Highlight bid price - check to highlight the last bid price.
|
Highlight ask price - check to highlight the last ask price.
|
|
Highlight high price - check to highlight the high price for the day.
|
Highlight low price - check to highlight the low price for the day.
|
|
Highlight cursor price - if checked, the price under your cursor is highlighted along the chart's price axis.
|
Show horizontal crosshair line - when checked, both the vertical and horizontal crosshair lines are displayed on a chart when you are in Crosshair Mode. When unchecked, only the vertical crosshair line displays.
|
|
Auto-complete trendline - if checked, you can instruct TWS to complete a freehand trendline. Begin your trendline by clicking and holding the mouse. To use auto-complete, release the mouse key, then click again. TWS completes the trendline across the chart, following your trajectory.
|
Show sub-chart security selection box - when checked, a box asking if you want the sub-chart to use the same security as the selected chart is displayed when you elect to Add New Chart.
|
|
Disable order label - when checked, when you create an order with ChartTrader, the order "line" on the chart is labeled with the action, order type and order status. Unchecking removes this order label.
|
Share trend line among charts - if checked, a trendline drawn on one chart will appropriately be reflected on other active charts on the same underlying.
|
|
Show constant number of bars - if checked, all charts will use the same number of bars as defined below in the Constant number of bars field.
|
|
|
Display price axis - use the dropdown list to display the price axis on the right, left or both right and left.
|
Display time axis - use the dropdown list to display the time axis on the top, bottom or both the top and bottom.
|
|
Bar chart spike protection (max. % change from previous bar) - if you want to apply spike protection, enter a percentage value. If any bar exceeds this percentage relative to the previous bar, it is automatically eliminated from the chart.
|
|
|
|
|
Modify the colors of chart parameters.
Define how to show, and whether or not to show, price/value information.
Define the layout of the Time & Sales page that you can display for a chart.

