Available Market Data Columns
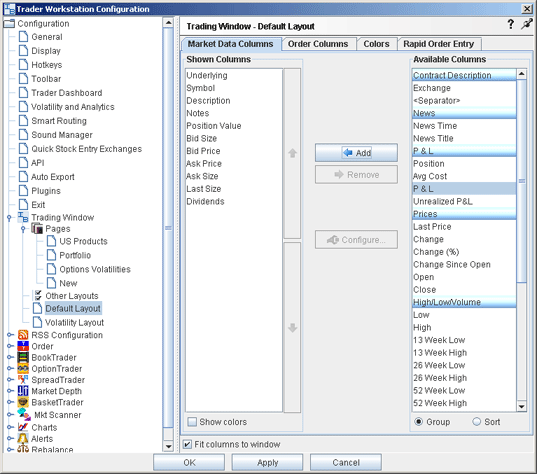
The table below identifies all of the available market data columns that you can display on your trading screen. Entries in bold are always displayed. For details on how to hide/display market data columns, see the topic Display Market Data Columns.
NOTE: If you want to see all columns on the trading screen by automatically truncating the column names, check Enable column auto-resizing. Otherwise, a scroll bar is displayed if the number of columns is too large to be accommodated on the trading screen.
|
Column Name |
Description |
|
Contract Description |
|
|
The underlying symbol for the contract. To toggle between underlying and symbol mode, on the View menu select the desired mode. |
|
|
Shows the exchange symbol for the contract. |
|
|
The market data exchange. If no other exchange is specified for order routing, this exchange is also where the contract will be routed. Select SMART order routing to route directly to the best available market. |
|
|
Identifies the instrument type and other descriptive contract information. |
|
|
An editable, unlimited text field where you can enter notes about the underlying, etc. When you mouse over the Notes text, it displays in a pop up box so you can read the entire note. NOTE: The Notes field is not editable on system-generated pages, since these pages (including the Pending page and Portfolio page) function differently from user-maintained pages. They are dynamically created and populated at the start of a TWS session and do not have the capability to save user-entered text. |
|
|
Uses colors to identify whether or not there is stock available for the customer to short it. Colors relay the following information: Red - No shares are available Dark Green - The system is trying to locate shares. Light Green - At least 1000 shares are available. |
|
|
News |
|
|
Displays the time and date of the latest contract-related news story. Rows use a color gradient to help differentiate latest from oldest stories at a glance. To view this field, you must activate the RSS News feed feature via the Feature Selector>Fundamental Analysis category. |
|
|
News Title |
Displays the title of the news story. To view this field, you must activate the RSS News feed feature via the Feature Selector>Fundamental Analysis category. For a deeper look at a story, double-click the title. |
|
Your current position in the selected contract. |
|
|
The average cost of the current position. |
|
|
Equal to (position * market price). |
|
|
Displays gains or losses. To modify the P&L calculation used, right-click the field and check or uncheck the box to Include new position in P&L calculation. |
|
|
Calculates unrealized P&L for stocks, stock options and futures options. Unrealized P&L is calculated using the formula: (current market price - average cost/share) x total number of shares The average cost per share is updated in realtime. This field is automatically added to the Trading window when the customer takes a position. Once removed it is not automatically added again. |
|
|
Realized P&L |
Calculates the realized profit and loss per position. |
|
Cost Basis |
The cost basis is calculated using the formula: average price x position x multiplier |
|
Prices |
|
|
The approximate depth of the current bid. |
|
|
The best bid price for a contract. This is the best price at which you could currently SELL. |
|
|
The best ask price for a contract. This is the best price at which you could currently BUY. |
|
|
The approximate depth of the current offer. |
|
|
The last price at which the contract traded. A "C" in front of the last price indicates that this is the previous day's closing price. |
|
|
How much the current price has risen or declined from the previous day's closing price. If the price has declined, the background is red. If the price has risen, the background is blue. To toggle between dollar change and percent change, click the column title. |
|
|
The percentage that the current price has risen or declined from the previous day's closing price. If the price has declined, the background is red. If the price has risen, the background is blue. To toggle between percent change and dollar change, click the column title. |
|
|
Change Since Open (%) |
The change in price (by dollar value or percent) since the day's opening price. If the price has declined, the background is red. If the price has risen, the background is blue. To toggle between percent change and dollar change, click the column title. |
|
The size of the last contract traded. If the last contract traded is larger than the previous one, the font is green. If it's smaller, the font is red. |
|
|
Displays dividends for EFPs. |
|
|
The opening price for the day. |
|
|
Displays the last available closing price for the asset. For US equities, we use corporate action processing to get the closing price. This means the close price is adjusted to reflect forward and reverse splits, and cash and stock dividends. |
|
|
Displays the difference between the previous night's closing price and the day's opening price. You can toggle this display between showing the gap in currency units or percentage points (100% x Gap / Today's Open). To toggle the display, right-click the column title and select Toggle Display. |
|
|
High/Low/Volume |
|
|
Low price for the day for the selected contract. |
|
|
High price for the day for the selected contract. |
|
|
The lowest price for the past 13 weeks. |
|
|
The highest price for the past 13 weeks. |
|
|
The lowest price for the past 26 weeks. |
|
|
The highest price for the past 26 weeks. |
|
|
The lowest price for the past 52 weeks. |
|
|
The highest price for the past 52 weeks. |
|
|
Trading volume for the day for the selected contract. |
|
|
The average daily trading volume over 90 days (multiply this value times 100) |
|
|
Options |
|
|
Used only for options. Identifies the exchange(s) posting the best bid price on the options contract. |
|
|
For options. The option model price is calculated using the underlying price, interest rate, dividends and other data that you enter using the Option Model Editor. |
|
|
Used only for options. Identifies the exchange(s) posting the best ask price on the options contract. |
|
|
For options. The implied volatility is based on the average of the best bid and offer for an option. This calculation is non-linear, and may not converge for low vega options. In such cases, no implied volatility estimate will be displayed. |
|
|
Displays actual historical volatility for an option. |
|
|
A prediction of how volatile an underlying will be in the future. The IB 30-day volatility is the at-market volatility estimated for a maturity thirty calendar days forward of the current trading day, and is based on option prices from two consecutive expiration months. |
|
|
Charts the total number of options that were not closed. You can display option open interest on the trading page, or in the OptionTrader option chains. |
|
|
The total number of contracts traded over a specified time period. |
|
|
Vol Change |
Change in volatility from the previous day's close. |
|
Opt. Volume Change |
Change in volume from the previous day's close. |
|
Put/Call Volume |
Put option volume/call option volume for the trading day. |
|
Call/Put Volume |
Call option volume/put option volume for the trading day. |
|
Put/Call Interest |
Put option open interest/call option open interest. |
|
Call/Put Interest |
Call option open interest/put option open interest. |
|
Bond |
|
|
The yield-to-worst. This is the lower of yield to maturity and yields to all calls. The yield is only shown if it is offered on the exchange. |
|
|
The yield-to-worst. This is the lower of yield to maturity and yields to all calls. The yield is only shown if it is offered on the exchange. |
|
|
The yield-to-worst. This is the lower of yield to maturity and yields to all calls. The yield is only shown if it is offered on the exchange. |
|
|
Bond attributes of last sale price which may include:
|
|
|
Auction |
|
|
For Arca Options auctions, this is the price at which the auction would occur if no new orders were received, i.e. if the auction were held now. |
|
|
For Arca Options auctions, this is the number of shares that would change hands if no new orders are received, i.e. if the auction were held now. |
|
|
For Arca Options auctions. Shows you how many more shares are on one side of the auction than the other. Blue means an imbalance on the buy side (more buy orders), red means an imbalance on the sell side (more sell orders). |
|
|
Fundamentals |
|
|
Market Cap |
The market cap value is calculated as follows: Current Price x Current Number of Shares Outstanding |
|
This growth rate is the compound annual growth rate ofEarnings Per Share over the last 5 years, excluding Extraordinary Items and Discontinued Operations. NOTE: If the value for either the most recent year or the year furthest out is zero or negative, the growth rate cannot be calculated and 'NA' (Not Available) will display. |
|
|
This ratio is calculated by dividing the current Price by the sum of the Diluted Earnings Per Share from continuing operations BEFORE Extraordinary Items and Accounting Changes, over the last four interim periods. |
|
|
Also known as the Acid Test Ratio, this value is defined as Cash plus Short Term Investments plus Accounts Receivable for the most recent interim period divided by the Total Current Liabilities for the same period. NOTE: This item is Not Available (NA) for banks, insurance companies and other companies that do not distinguish between current and long term assets and liabilities. |
|
|
This is the sum of the Cash Dividends per share paid to common stockholders during the last trailing twelve month period. |
|
|
This value is the Income Available to Common Stockholders for the trailing twelve months divided by the Average Common Equity, and is expressed as a percentage. Average Common Equity is calculated by adding the Common Equity for the 5 most recent quarters and dividing by 5. |
|
|
This is the Current Price divided by the latest interim period Book Value Per Share. |
|
|
Graphic Prices |
|
|
Bid Spinner |
A green bar whose placement in the field represents the cents in the current best Bid price, relative to a dollar. A bar in the center of the field indicates that the cents value in the Bid price is close to $.50. A bar toward the left indicates that the cents value is closer to zero, and to the right indicates it's approaching one dollar. |
|
Ask Spinner |
A red bar whose placement in the field represents the cents in the current best Ask price, relative to a dollar. A bar in the center of the field indicates that the cents value in the Ask price is close to $.50. A bar toward the left indicates that the cents value is closer to zero, and to the right indicates that it's approaching one dollar. |
|
Last Spinner |
A magenta bar whose placement in the field represents the cents in the current Last price relative to a dollar. A bar in the center of the field indicates that the cents value in the Last price is close to $.50. A bar toward the left indicates that the cents value is closer to zero, and to the right indicates that it's approaching one dollar. |
|
Graphic Change |
A graphic representation of the difference between the last price and the previous day's closing price. The arrow is centered in the field, and colored green if the last price is higher than the close, and colored red if it's lower. The longer the arrow the wider the difference between the two prices. The field accommodates graphing changes up to $2.00 below and $2.00 above the close. |
|
Smart Spinner |
A graphic representation of the cents in the current price relative to a dollar. If you hold a short position, the bar is red and represents the cents in the Ask price. If you hold a long position, the bar is green and represents the cents in the Bid price. For contracts in which you hold no position, the bar is gray, and represents the cents in the Last price. A bar in the center of the field indicates that the cents value in the price is close to $.50. A bar toward the left indicates that the cents value is closer to zero, and to the right indicates that it's approaching one dollar. |
|
Candlestick |
A graphic representation of the direction and magnitude of price change. The wide end of the arrow represents the opening price, and the narrow end represents the last price. An arrow pointing to the right indicates that the price is higher than the previous close, and an arrow pointing to the left indicates that the price has dropped from the previous close. A brighter shade indicates a greater magnitude of price change. |
|
Range |
A graphic comparison of the last price to the day's high and low. The indicator starts in the center of the field and moves toward the left (in red) as the last price approaches the day's low, and to the right (in green) as the last price approaches the day's high. If the last price equals the low or high, the bar changes color. You can elect to view the Range in three visual different modes, basic Range, Range 3D, and Range 3D Alert. Only the last shows a color change when the price equals the high or low. |
Copyrights and Trademarks