Stock/ETF Benchmarker

Stock/ETF Benchmarker


Provides the ability to benchmark a portfolio against a user-selected benchmark index for the current day, and show the contribution and weighting of individual equity positions.

Performance attribution analysis is a process designed to determine how a portfolio is performing relative to a specific benchmark, and to highlight areas of the portfolio that are over- or under-performing. The Stock/ETF Benchmarker displays portfolio performance attribution values which update in real time throughout the day 1.


Open the tool:

  • From Mosaic: Use the New window dropdown and from the Other Tools section select Portfolio Tools and then Stock/ETF Benchmarker.
  • From Classic View: Use the Analytical Tools menu and in the Portfolio section select Stock/ETF Benchmarker.

The Interface

Stock/ETF Benchmarker Screen

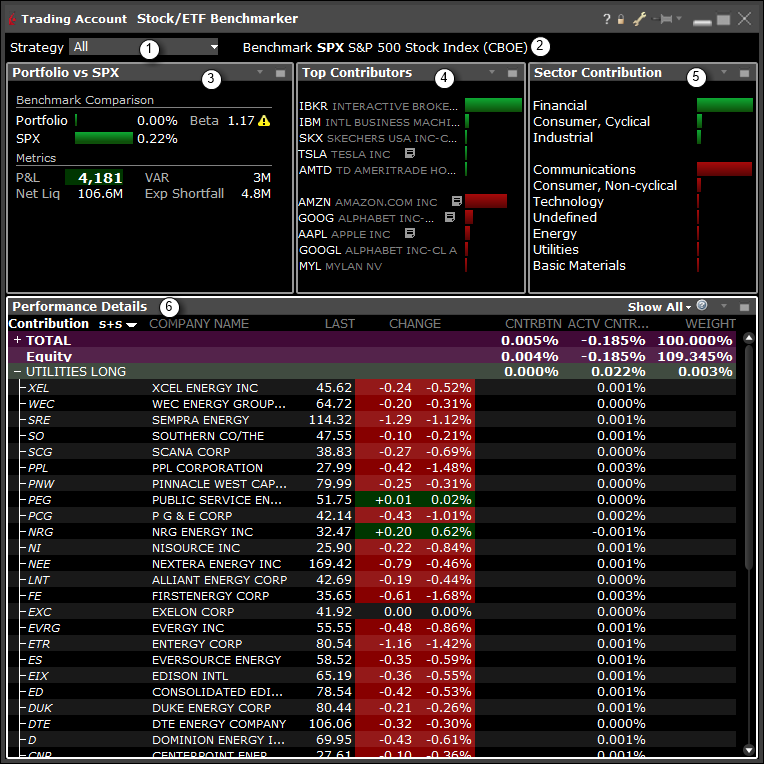
  1. Select a strategy to benchmark.
    1. Advisors will see individual client accounts plus Model Portfolios, Portfolio Strategies, and account groups.
  2. The SPX index is used as the benchmark.
  3. Benchmark Comparison shows your portfolio¹s performance compared to the SPX index. Metrics are the taken from the Account Information window (Net Liq) and Risk Nav (Beta, VAR, Est Shortfall).
  4. Top Contributors — Sorts contribution to the overall portfolio by security. Lists the top five and bottom five equity components by contribution, indicated both by percentage and graphically using a colored bar.
    1. Value is also reflected in the Performance Details "Contribution" field.
  5. Sector Contribution — Sorts contribution by sector. Lists sectors by contribution, from highest to lowest. Indicated both by percentage and graphically using a colored bar.
    1. Value is also reflected in the Performance Details "Contribution" field.
  6. Performance Details
    1. Sorting Entries: Sort by "Sector + Side" or "Industry + Side" (NOTE: more sort selections coming soon).
    2. Contribution field: Shows the contribution (by percent) of each security or category (ie. Industry) to the overall portfolio.
    3. Active Contribution field: The difference between the contribution to the portfolio return and the contribution to the benchmark return for a specific security or category.
    4. Weight field: The weight of each security or category contribution to the portfolio.
    5. NOTE: Use the "insert" feature to add Benchmarker fields. Benchmark Contribution and Benchmark Weight which show the percent contribution and weight of the security to the overall benchmark.

The Math

Calculations for weights, returns and contributions, along with samples, are shown below 2.

Weight in the Portfolio

At the current time (T), the weight of security "s" in portfolio "P" is given by:

Math Equation

where mvsT is the market value of s at the current time, and mvPT is the market value of the portfolio at the current time.

Portfolio Return for the Day

The total portfolio return for the day in shown in the comparison tile in the upper-left corner. At the current time (T), the return for the day is given by:

Math Equation

where PNLPT is the overall PNL on the portfolio at the current time, and NAVP0 is the prior day's closing NAV for the portfolio.


Contribution to Portfolio Return

The contribution of a security to return of security "s" in portfolio "P" over the time ranging from (0; T) where "T" is the current time is given by:

Math Equation

Where PNLsT is the daily PNL on s at time T, and NAVP0 is the prior day's closing NAV for the account.


Sector Contribution to Portfolio Return

The cumulative contribution of a sector (or other grouping) "G" to the return of a portfolio "P" over a period (0; T) is defined as:

Math Equation


Long and Short P&L Example

If the side of the position changes at any point during the day, such as when a client reverses a position (close a position then establish a position on the opposite side for the same amount of shares), the PNL is tracked separately for both the long and short portions of the overall position.

For each trade per security that has a realized P&L, we divide the PNL into a long or short bucket based on whether the trade was a buy or a sell.

We then calculate long and short contributions for the security, and compare to the benchmark index. For the example below, assume that:

  • The portfolio contains 1000 USD.
  • There are no cash inflows or outflows.
  • The portfolio starts with a "0" position in ABC.
Table 1 . Long and Short P&L Example
Action Quantity Symbol Realized PNL Net Position
Buy 100 ABC 100
Sell 200 ABC 10 USD -100
Buy 200 ABC 10 USD 100
Sell 200 ABC 10 USD -100

In the above example, the total realized PNL on ABC is 30 USD. Of this, 20 USD was realized by closing long positions, and 10 was realized by closing short positions. The contribution to return of long ABC is 2%, the contribution to return of short ABC is 1%, and the net contribution to return of ABC is 3%.

When displaying the weight for long ABC and short ABC, we look at the current weight. Therefore if the client is currently short ABC but was long at some point during the day, there will be a negative value in the weight column in the short ABC row (market value of short position is negative), and the long ABC row will show "0" for the weight (as the client is not currently long ABC).

If we also assume the benchmark was long ABC during this period, and the contribution of long ABC to the benchmark was 1%, then the active contribution of long ABC is 1% (2% - 1%), and the active contribution of short ABC is 1% (1% - 0%) as the contribution of short ABC to the benchmark return was 0.


Notes:

  • We don't calculate performance attribution for any products other than equities, but we calculate the performance of the equities based on the overall account value, which may include non-equity positions.
  • All calculations are done with respect to the portfolio's previous day closing NAV (so all positions, both equity and non-equity, are used in the calculation though only equity positions are individually weighted and displayed).
  • No intraday withdrawals or deposits are included (they will show up in tomorrow's calculations).
  • To accurately compare the portfolio to the benchmark SPX index, long and short positions are treated separately. For example, if the SPX index is long AAPL, but the portfolio is short AAPL, the short portfolio AAPL position will be compared to a theoretical "0" short AAPL position in the SPX index, rather than to the long AAPL position.
  • If a customer is both long and short a security at different points throughout the day, the PNL value is sliced into long and short components. See the Long and Short P&L Example in The Math section.
  • Non-base currency products will be converted to the account's base currency.
Disclosures
  1. The Stock/ETF Benchmarker calculates information for the current intraday period only. To view similar information over an historical period, please use the Portfolio Analyst. For details on how the attribution values in those reports are calculated, please see our white paper on the subject.
  2. As per Global Investment Performance Standards (GIPS), contribution to return is defined as 'weight x return'. This is the mathematical equivalent of 'P&L/NAV'.