Portfolio Analytics
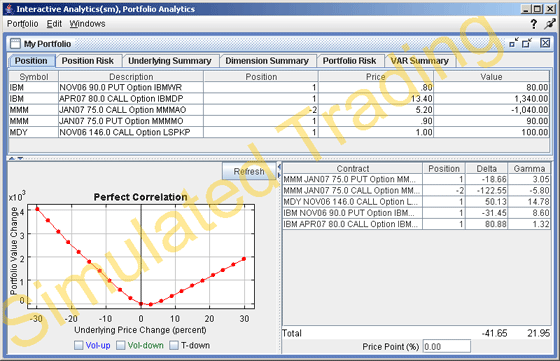
Portfolio Analytics, part of a suite of risk analysis tools included in IB's Interactive AnalyticsSM, allows you to look at slices of risk for your entire portfolio using the traditional Greek risk dimensions, across multiple asset classes. You can create "what-if" scenarios by dragging contracts into Portfolio Analytics from your trading screen and modifying the quantity and price point to affect hypothetical changes in the risk dimensions.
Portfolio Analytics is accessible from the Analytics menu on the trading screen, and from the Option Trader.
The Portfolio Analytics screens are split into two sections. The top section of each Portfolio Analytics page displays values directly relevant to your current portfolio, and is based on real-time market data. Each page in the tabset shows a slice of your risk. The tabset is organized as follows:
Position - All of your positions and their values sorted alphabetically by underlying.
Position Risk - The risk position for each underlying.
Underlying Summary - The total risk by expiry and risk dimension (Greek value) for each underlying.
Dimension Summary - The total risk by underlying and expiry for each risk dimension (Greek value).
Portfolio Risk - The equivalent portfolio risk for all positions, and a summary of all stock and options values in your portfolio.
VAR Summary - Shows the greatest loss that a portfolio will sustain over a one-day period, with 99% confidence.

The bottom section of each page displays a value plot and summary matrix. The Position, Dimension Summary, Portfolio Risk and VAR Summary pages show the Portfolio value plot, which includes results based on your entire portfolio. The Position Risk and Underlying Summary pages show a Sub-Portfolio value plot (i.e. a subset of the portfolio) for each tab, which includes all of your positions in a single underlying and all of its derivatives. In both cases, the information in the bottom section is derived from a pricing model which is updated daily.
Use the Vol-up, Vol-down and T-down checkboxes to view the plot under different scenarios to help you visualize the volatility and time risk in your option positions. Vol-up raises the implied volatility by 15% in relative change*; Vol-down reduces the implied volatility by 15% in relative change*, and T-down reduces the time to expiry by one calendar day.
*For an example of a relative percent change, if the current implied volatility of an option is 10%, a 15% relative change would result in an implied volatility of 11.5%, calculated as follows:
10% * (1 + 0.15) = 11.5%.